
All your key metrics and insights just a question away
Analyze instantly with your conversational AI agent. Get all your SaaS metrics, financial reports, usage trends, churn, and growth metrics in a single platform.
Trusted by fast-growing companies


360° view with AI-powered analytics
Transform how your teams interact with reports and make data-driven decisions. Zenskar unifies all your revenue information in a single platform.
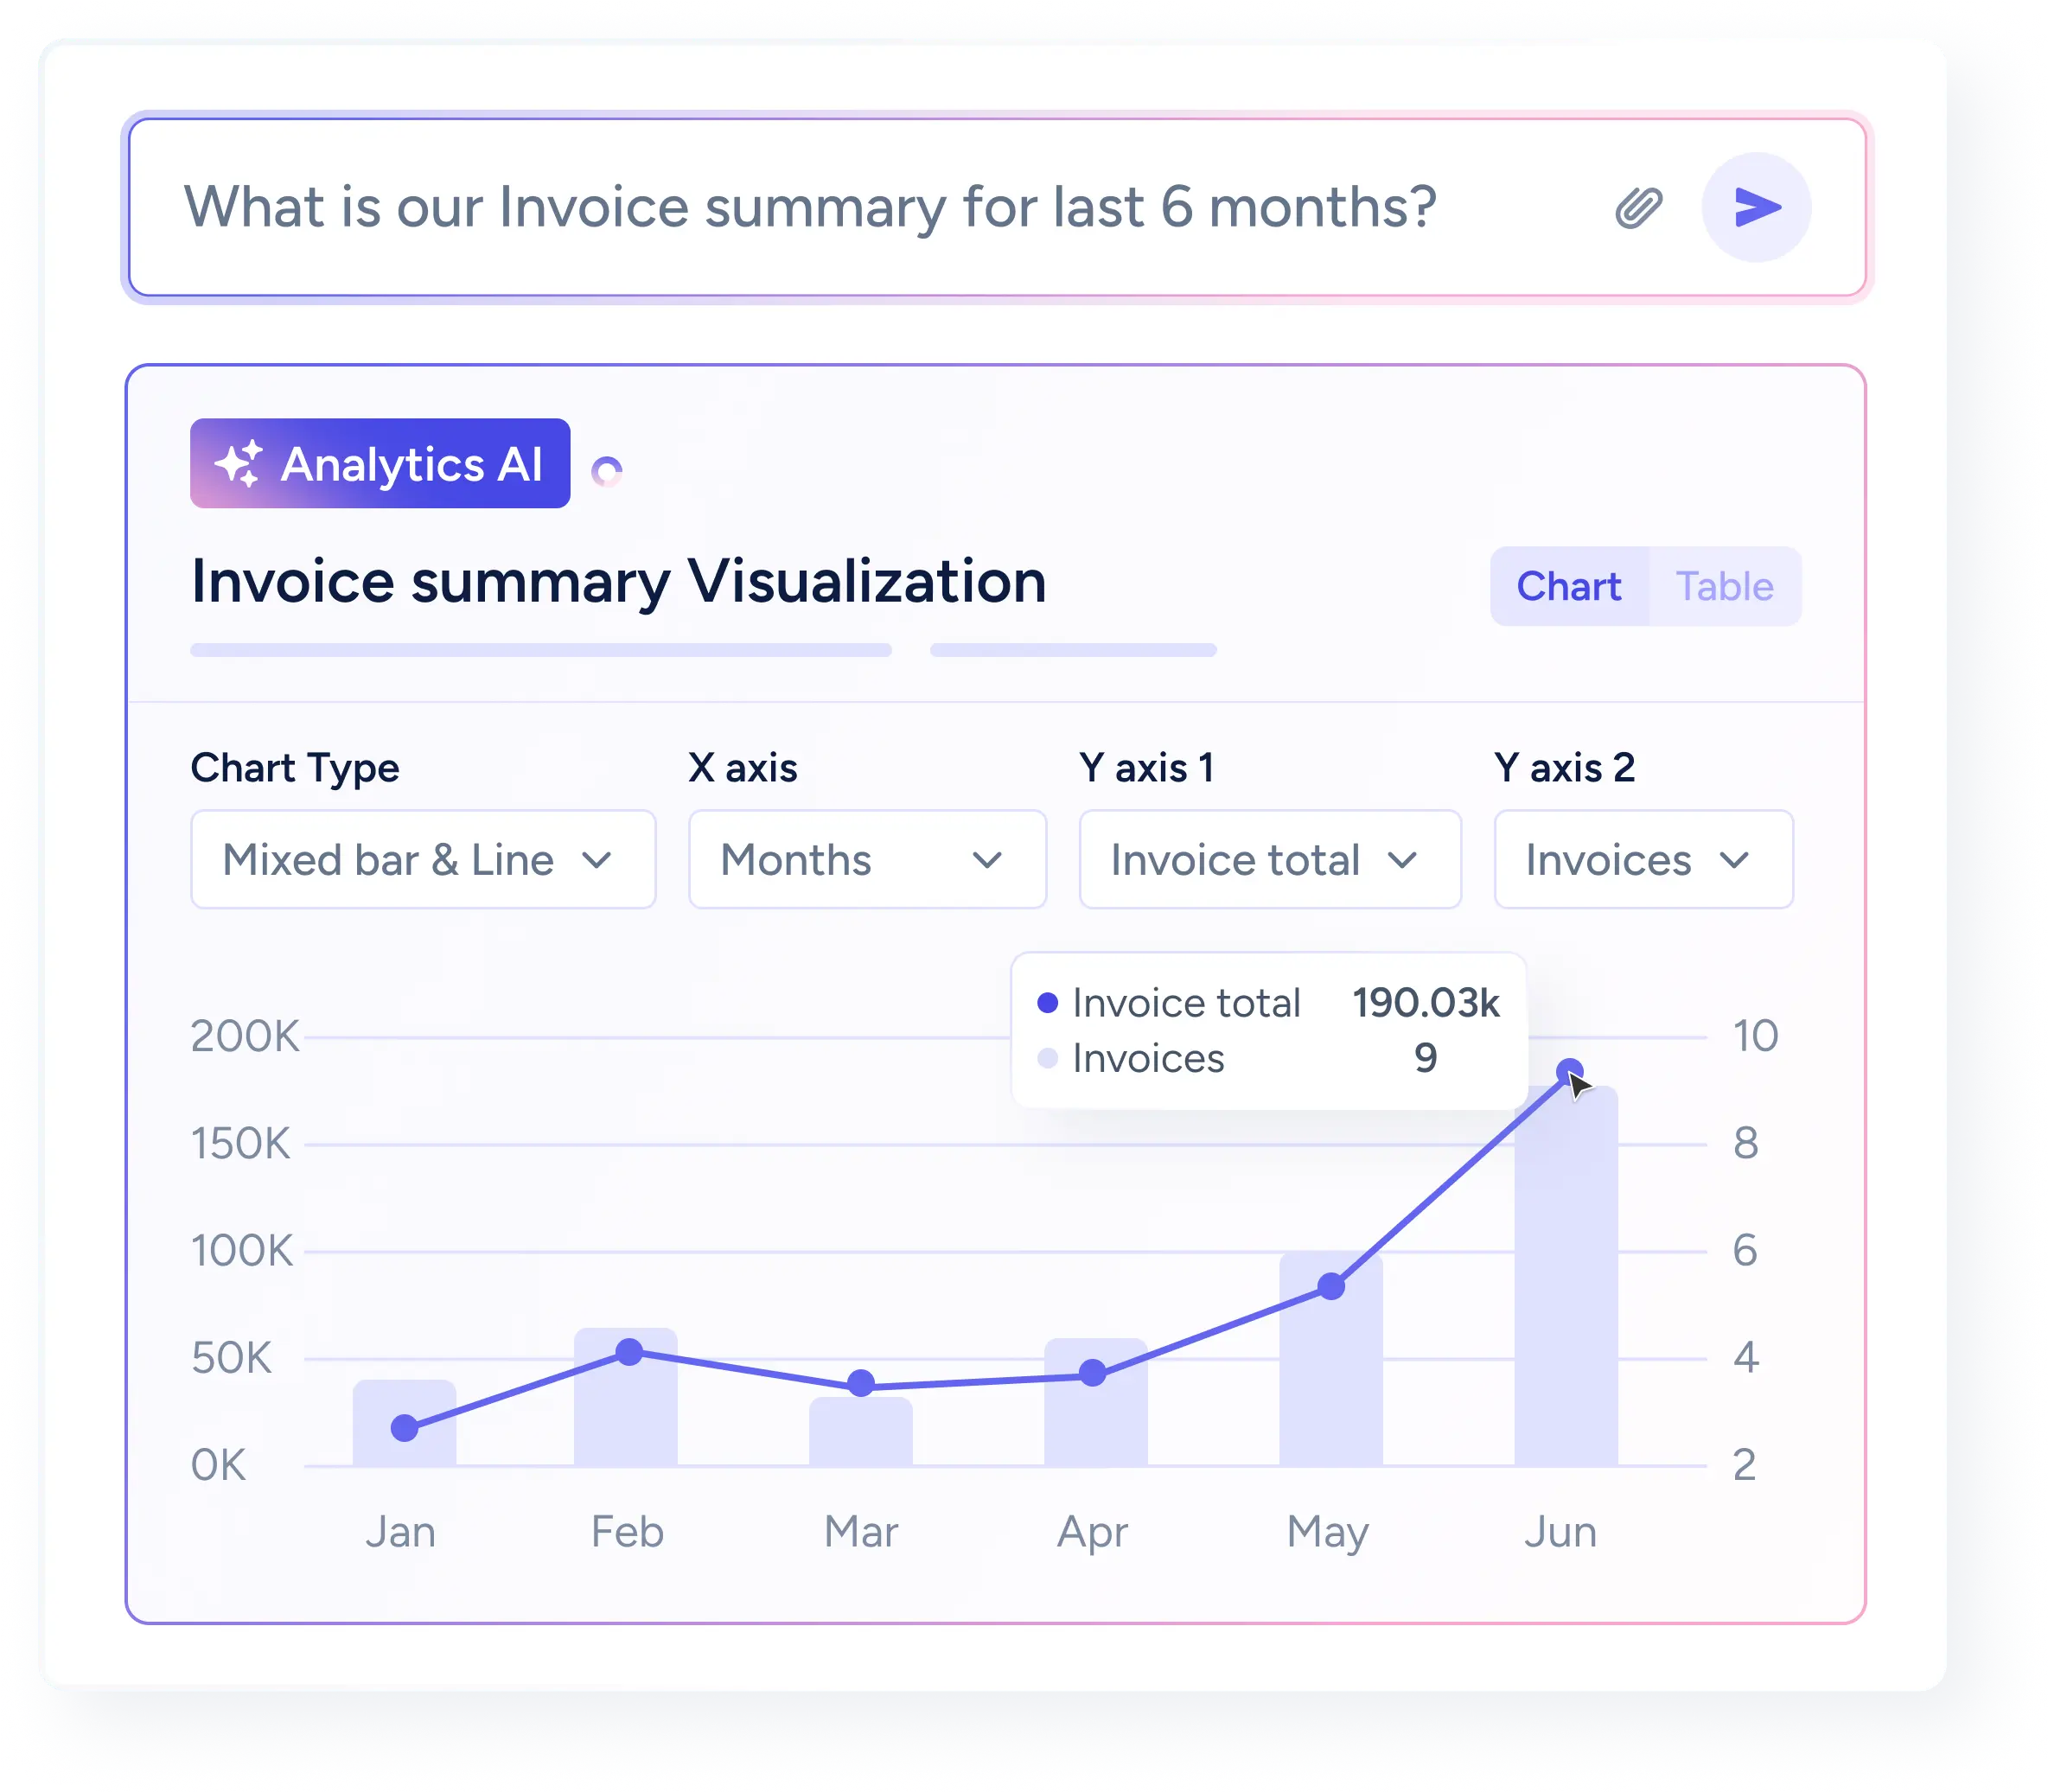
Get instant reports with AI, no more waiting
Empower every stakeholder with their own personal AI analyst. Power data-driven decision making with near real-time data and reports at your fingertips.
- Ask natural language queries to our conversational AI agent to get detailed reports in seconds. No SQL, model training, or additional context needed.
- Get presentation-ready charts, smart insights & proactive recommendations, and granular breakdowns within the chat interface.
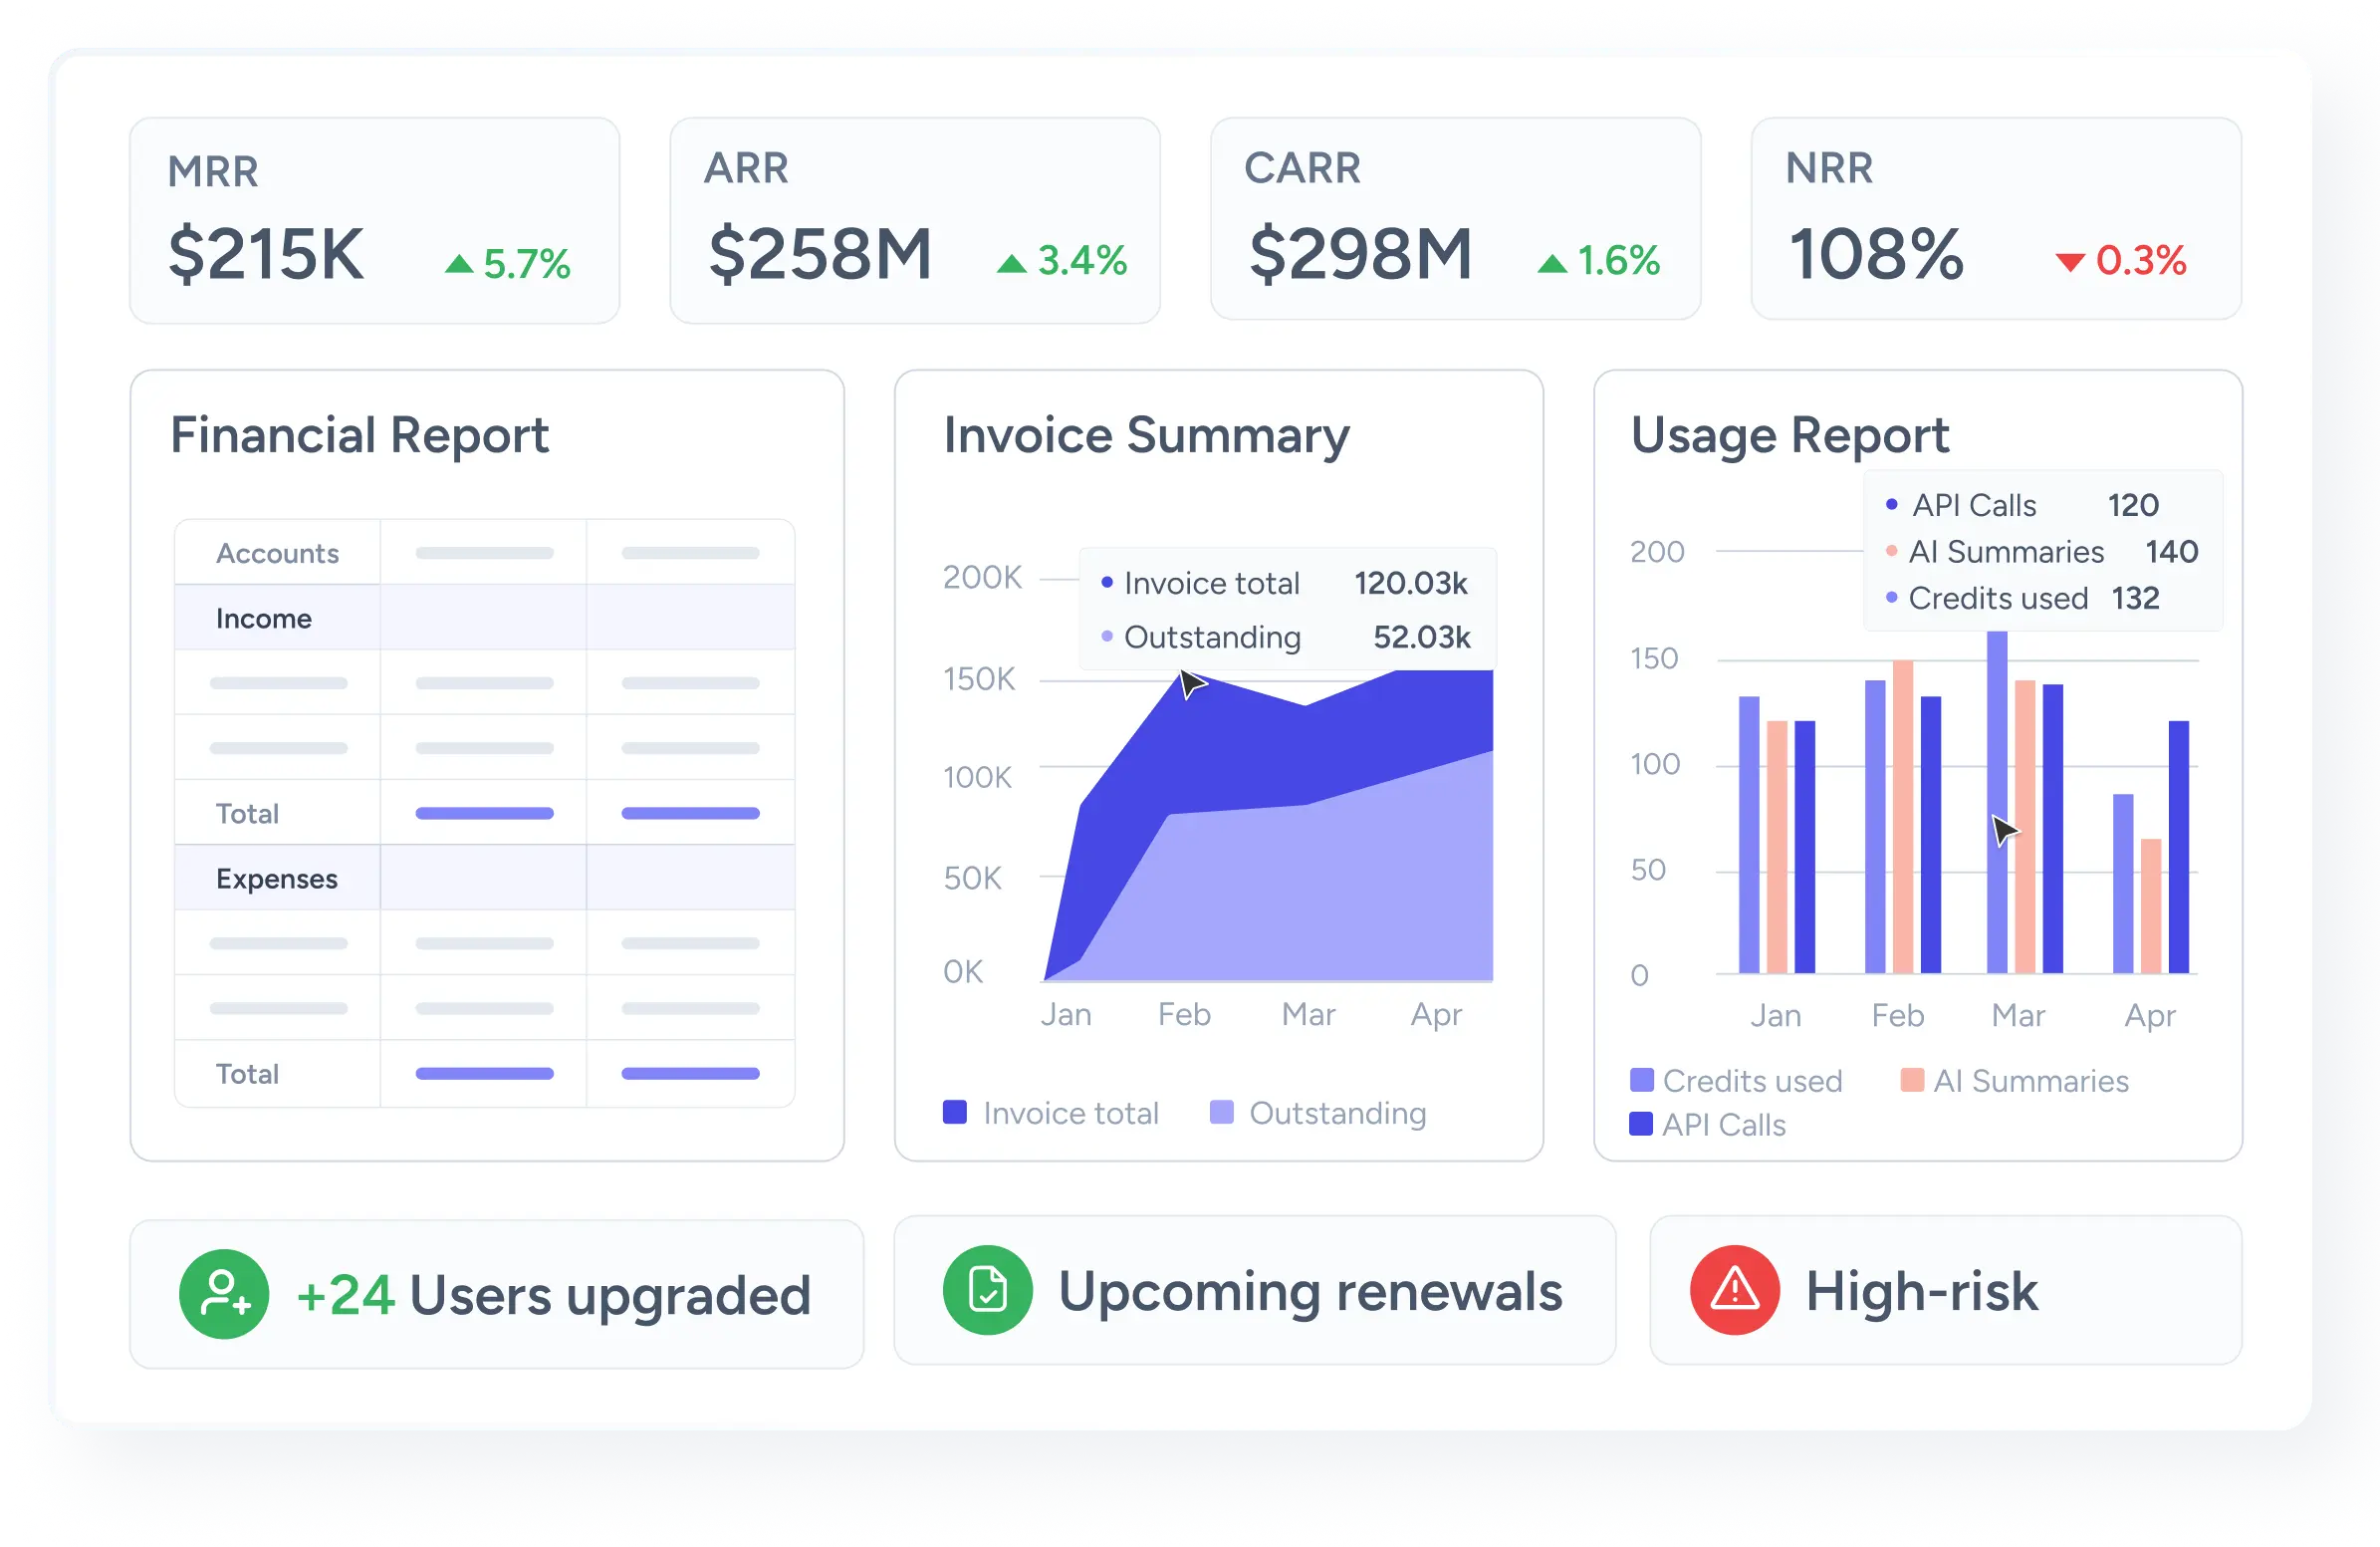
Single source of truth for your revenue information
Zenskar unifies all the data in your order-to-cash process in one place. No spreadsheets. No manual data collection or consolidation.
- Keep track of your revenue, collections, payments, and growth indicators – all in a single platform.
- Get GAAP-compliant, audit-ready income statements, balance sheets, and cash flow statements.
- Monitor usage trends and churn to understand and drive customer demand.
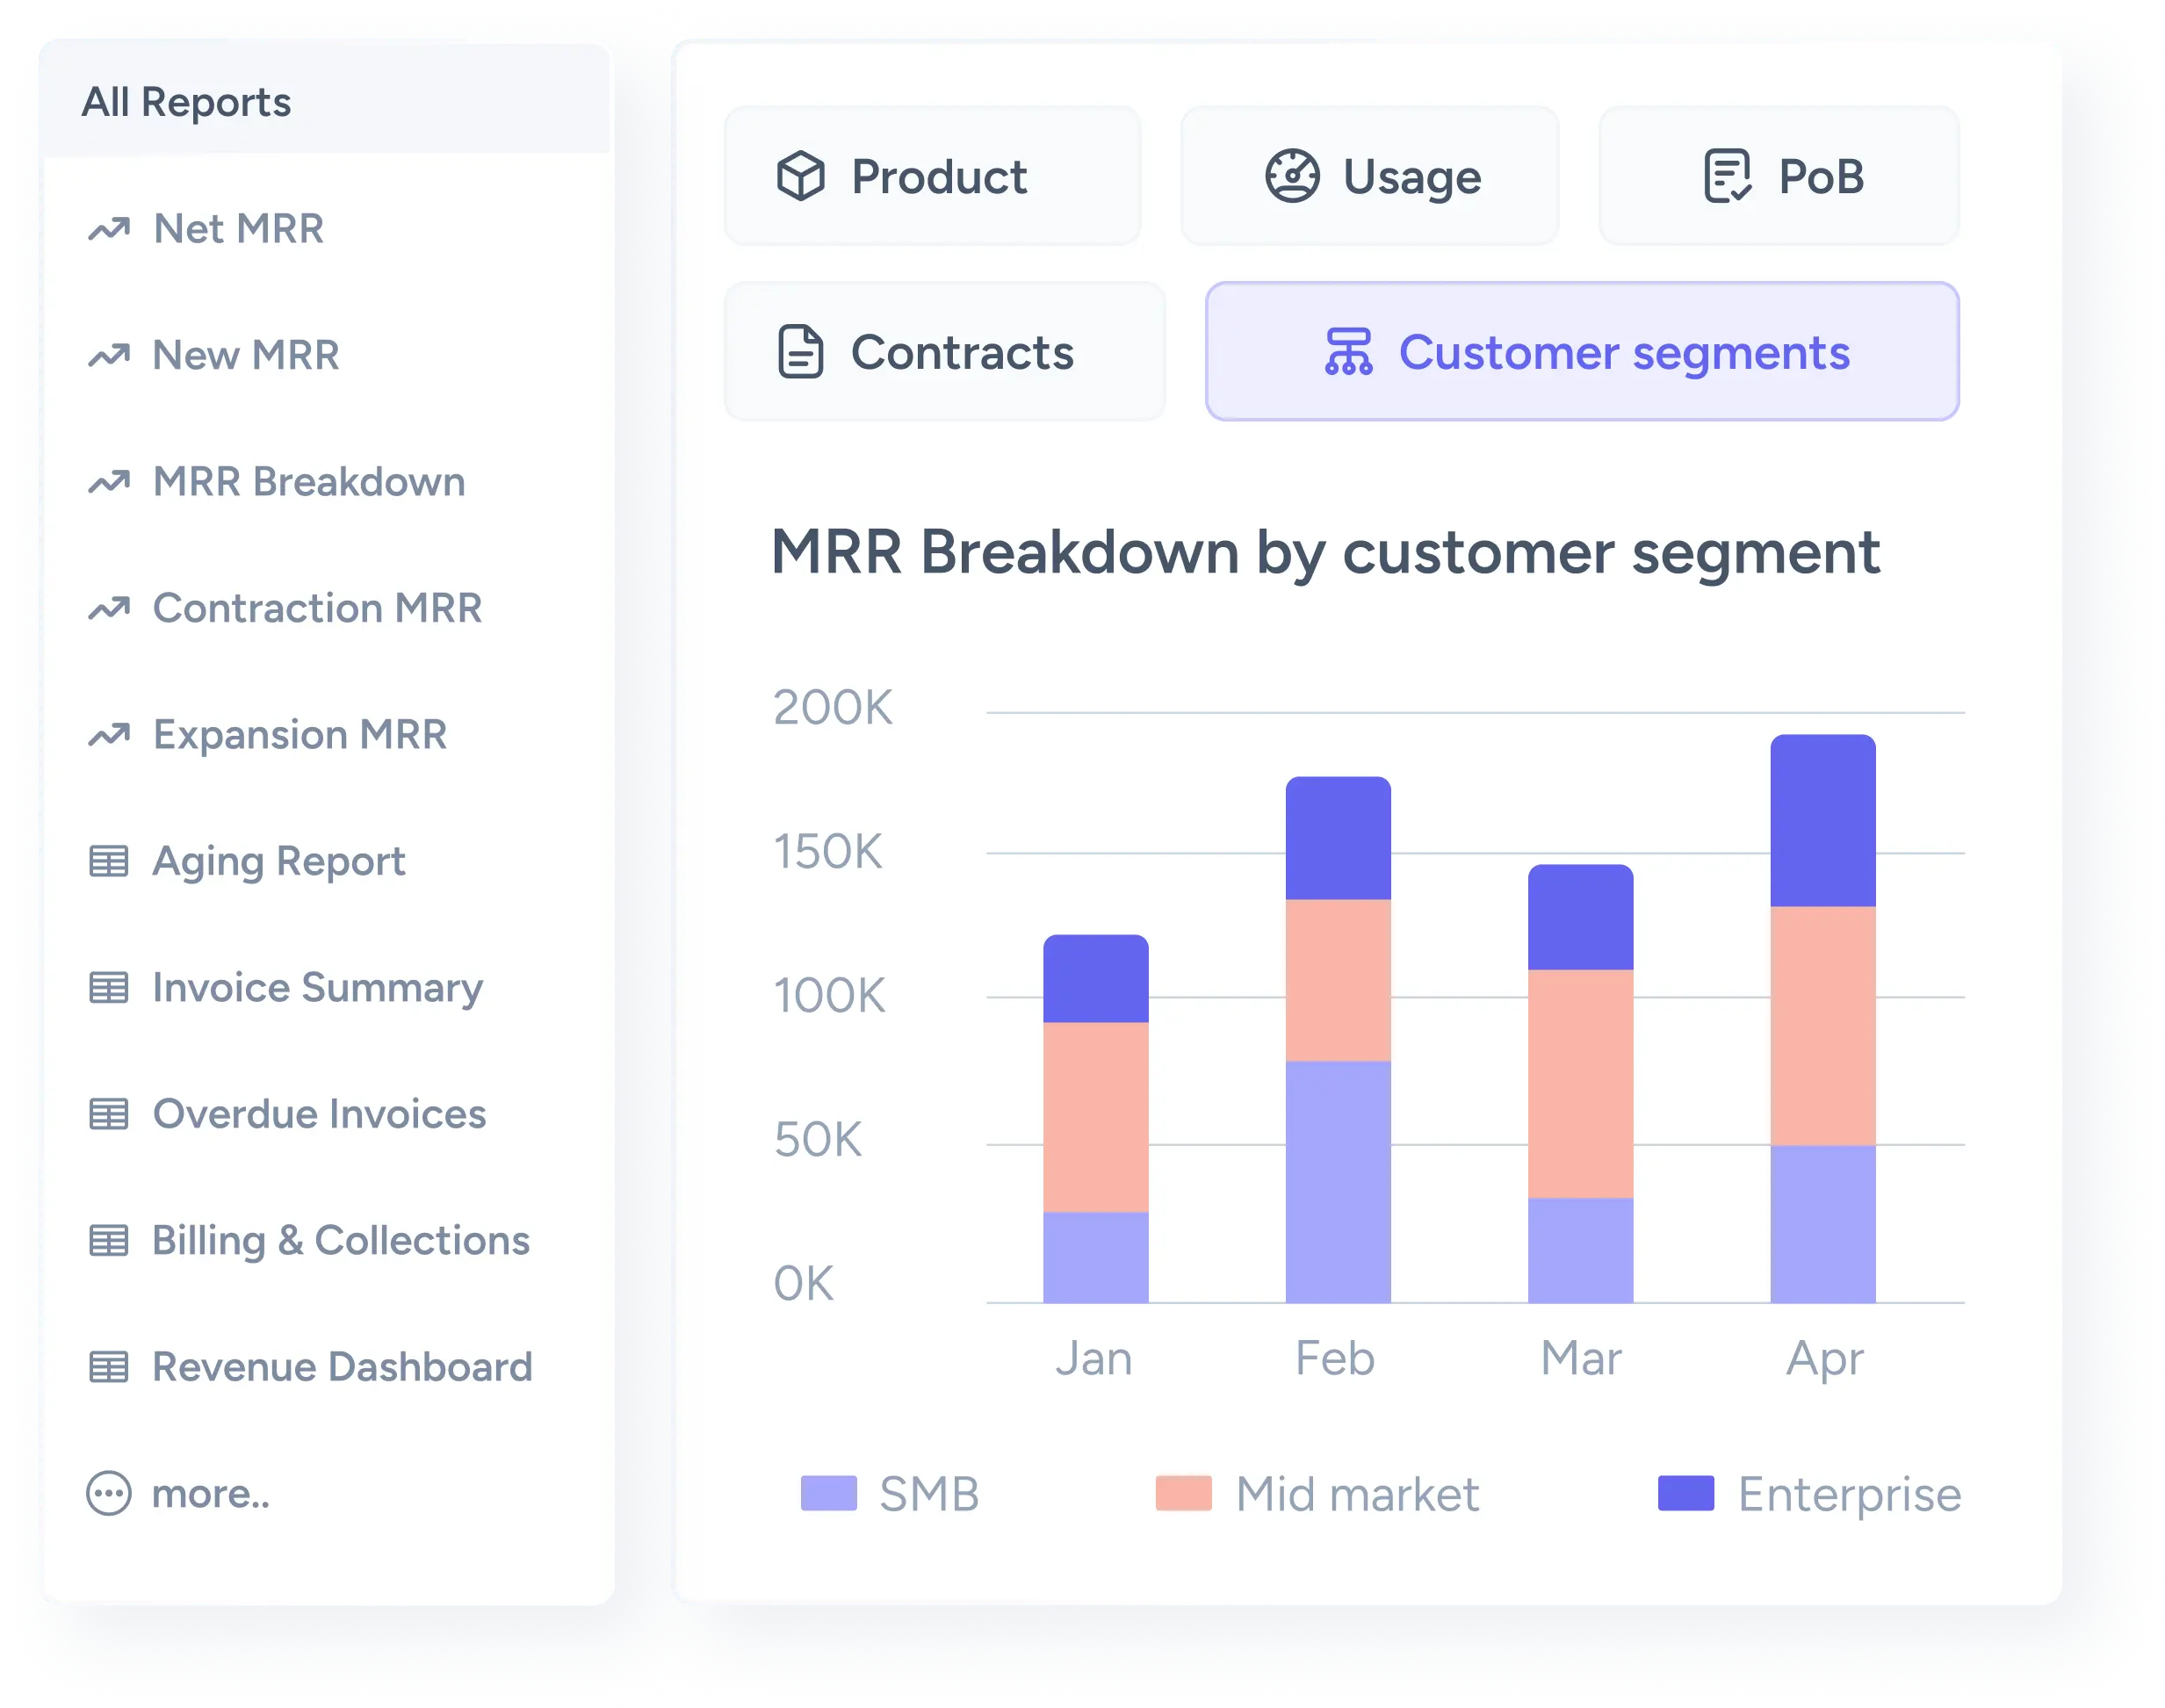
Get all the reports you need, off-the-shelf
Access dozens of ready-made reports tailored for modern businesses, enhanced with powerful drilldowns and AI-powered alerts and insights.
- Get reports like contraction/expansion MRR, NRR, and revenue waterfall off-the-shelf.
- Slice and dice any report to understand your revenue drivers with product, plan, segment, and usage breakdowns.
- Set up monitoring and alerts on your metrics and charts to stay in tune with the pulse of your business.
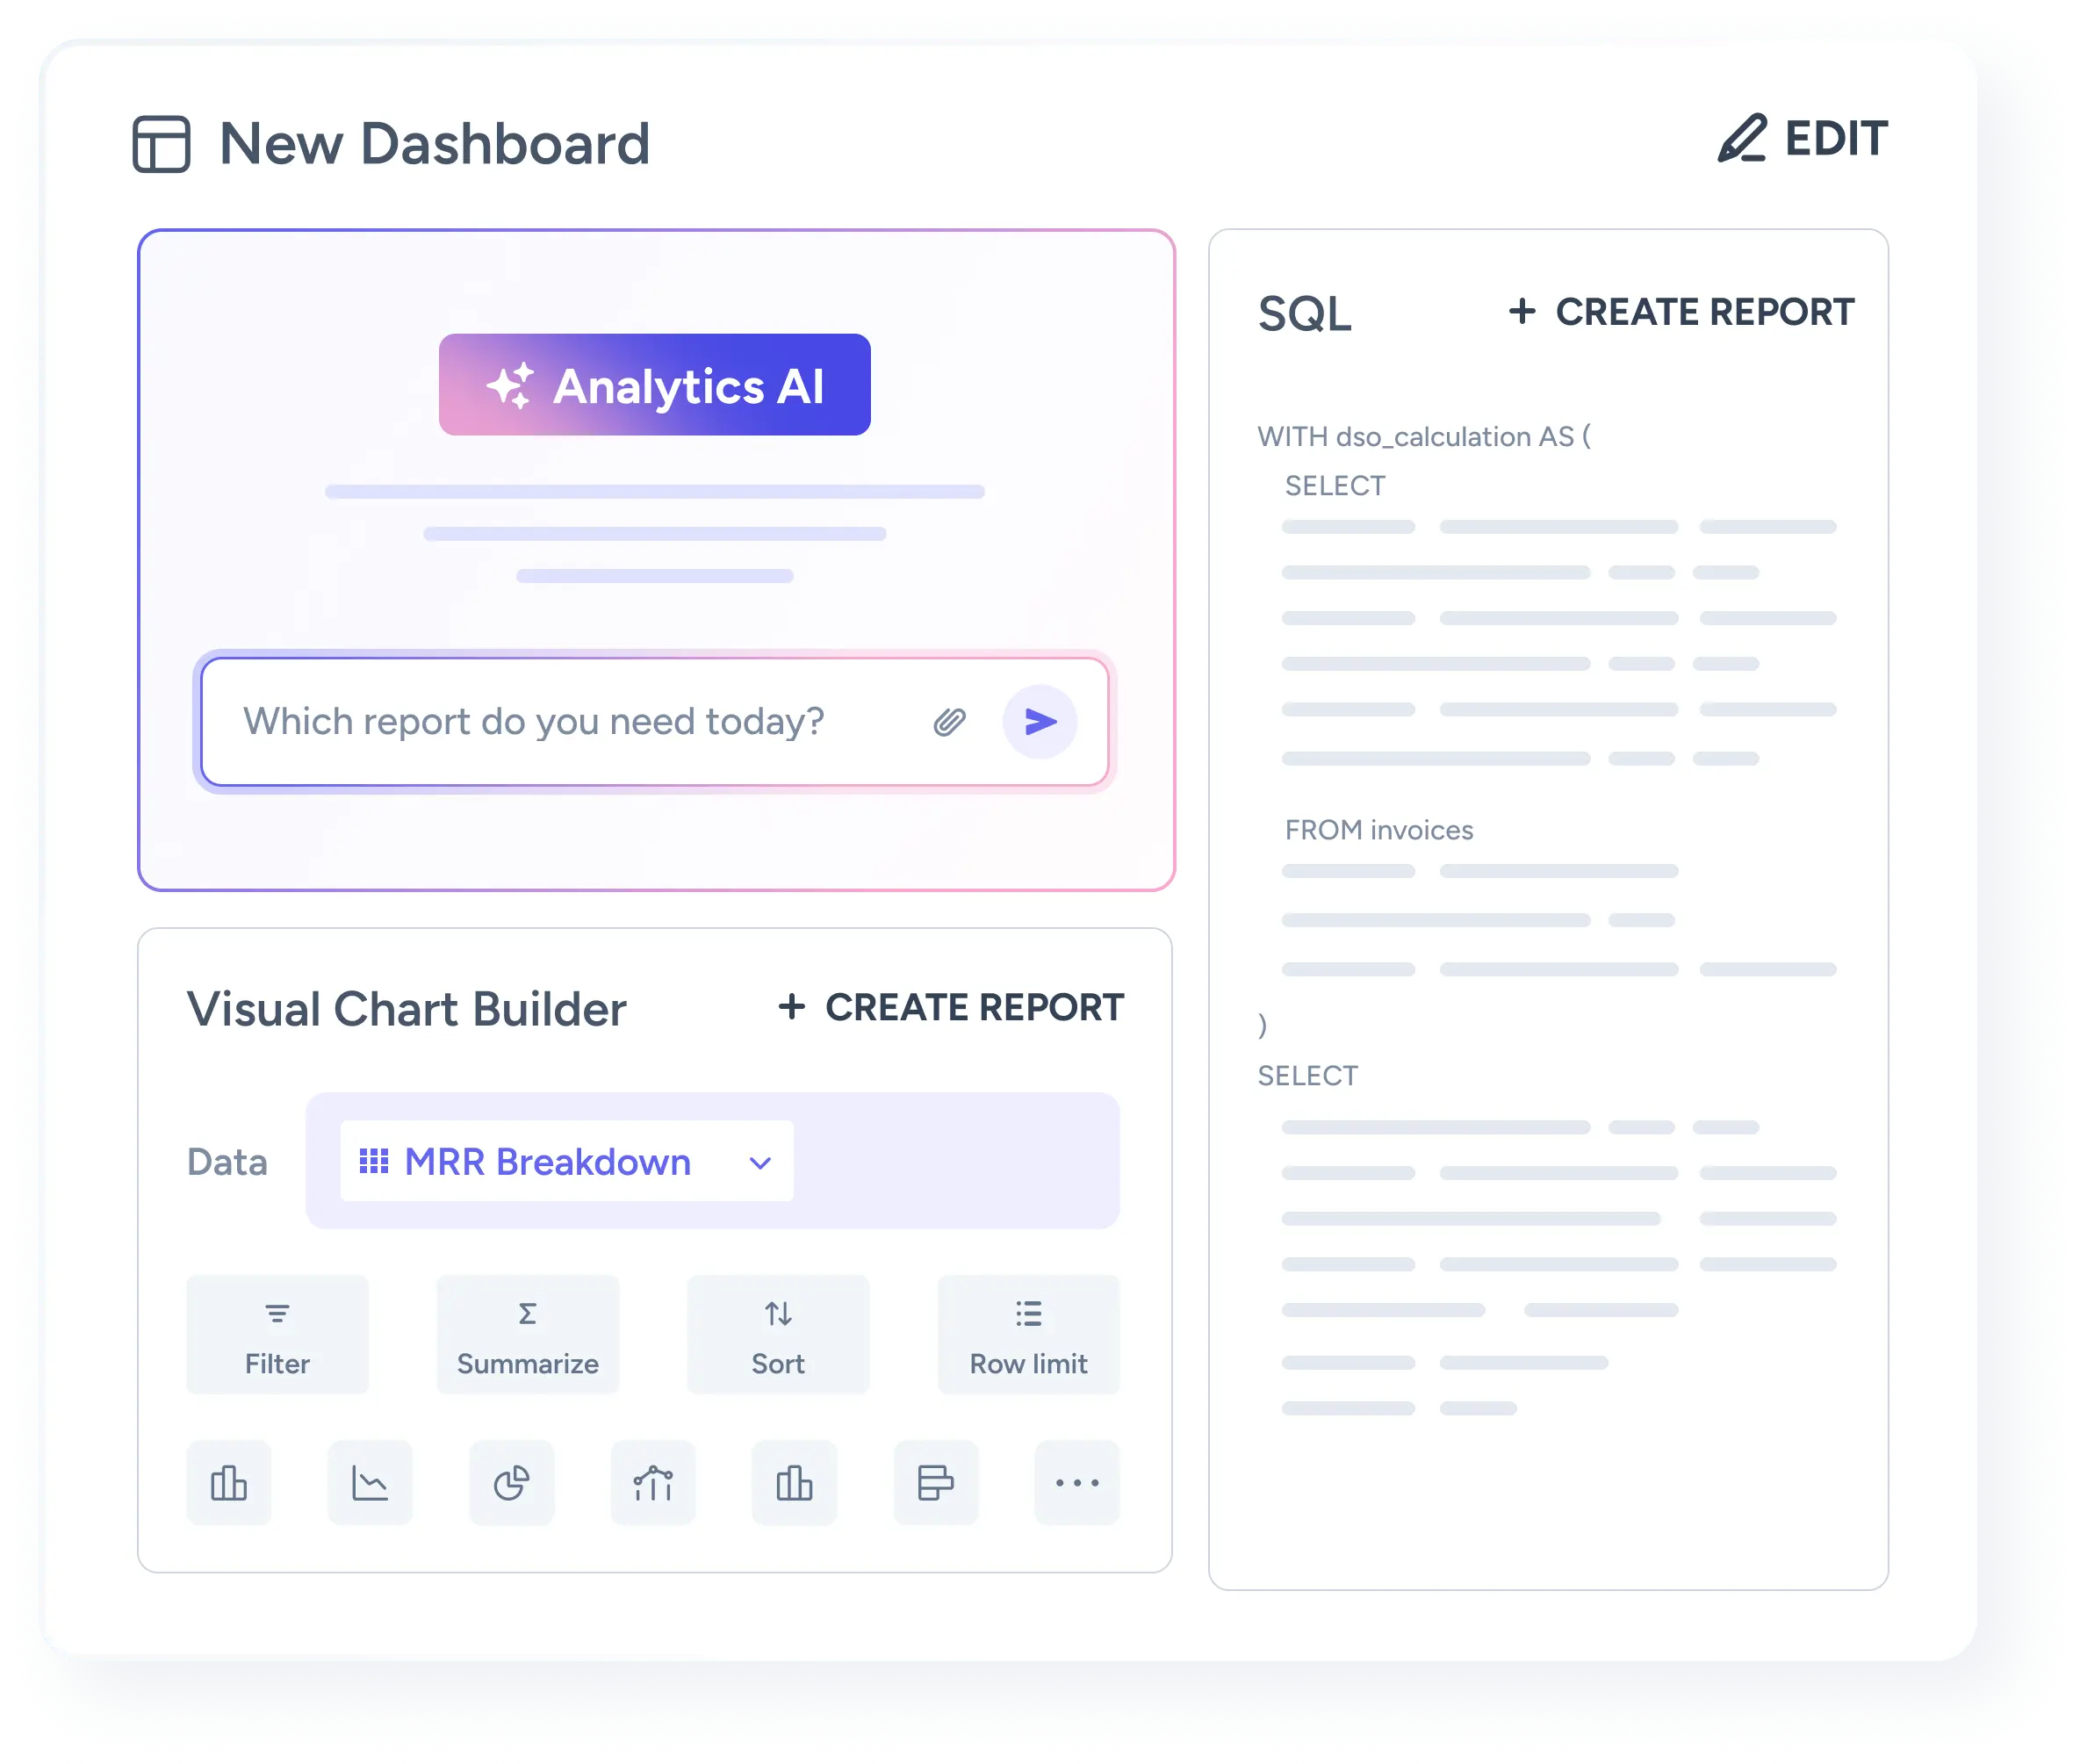
Build unlimited custom reports for your specific needs
Create and modify reports and dashboards to fit your business needs. Customizing reports on Zenskar is simpler than navigating sheets.
- Build reports through visual filters, SQL queries, or just ask Zenskar’s Analytics AI.
- Create and track specific segments with unlimited custom tags.
- Change report dimensions and visualizations for all your pre-built reports.

Powerful features powering intelligent analytics
Take charge of your reports, take charge of your growth. With off-the-shelf dashboards, custom reports, drill downs, alerts - we arm you with everything you need.
All the insights, without a single spreadsheet
Arm the C-suite with business insights
Transform data into actionable insights for smarter decisions and sustainable growth.
Instill investor confidence and trust
Build credibility with transparent reporting that showcases reliability and operational excellence.
Stay audit-ready and compliant
Meet financial standards effortlessly with automated reporting that eliminates compliance headaches.

Proven impact, delighted customers
From faster closes to reduced manual work — see how Zenskar empowers finance teams to move faster, smarter, and with confidence.

Matt Barnard

70% faster month-end closing
“We’re able to automate revenue recognition accurately for our value-based billing, reducing the manual hours spent by 70%.”

Noy Kalansky

Saved 200+ hours of grunt work
“We're saving 200+ hours/quarter on invoicing and receivables management by completely automating our recurring billing.”

Zachary Rattner
90% less engineering bandwidth
"We cut 90% of engineering bandwidth spent on billing. Zenskar integrated seamlessly with our tech stack, including Hubspot"

Kshitij Gupta

4 months faster product launch
“We launched our product 4 months faster instead of building an in-house system for our usage-based pricing model.”
Frequently asked questions
Zenskar's Analytics module empowers businesses with comprehensive reporting capabilities, generating in-depth reports that provide actionable insights. By leveraging internal data within the system, businesses can make informed decisions based on accurate and relevant information, ultimately driving growth.
Zenskar offers a pre-built chart library that provides access to a vast collection of charts for visualizing key metrics. These charts cover a wide range of essential statistics and metrics, enabling businesses to monitor performance at a glance. Additionally, users can customize their dashboards to display the specific charts and data visualizations that are most relevant to their business needs.
Zenskar's Analytics dashboard customization is designed to be user-friendly and intuitive. Users have the ability to build their own personalized dashboards using drag-and-drop functionality. This means that users can easily select and arrange the charts and data visualizations that matter most to them, tailoring their analytics experience to suit their specific requirements. This level of customization allows for informed decision-making based on personalized insights.
Stay future-ready with AI-powered order-to-cash
Zenskar scales with you - it's flexible, reliable, and enterprise-ready.


