

Definition
Net revenue retention (NRR) measures the percentage of recurring revenue retained from existing customers over a specific period, accounting for expansion, contraction, and churn. NRR indicates whether your existing customer base is growing or shrinking in value. Key principle: NRR focuses exclusively on existing customers, excluding new customer revenue to isolate retention and expansion performance.Prerequisite
Monthly recurring revenue (MRR) is the predictable revenue a business can expect each month from active subscriptions.
Formula
Component breakdown
Note: New customer revenue is explicitly excluded from NRR calculation.
Business significance
Performance interpretation
Strategic importance
Growth sustainability: High NRR indicates sustainable growth from existing customer investment Product-market fit: Strong NRR suggests customers find increasing value in your solution Expansion opportunity: Shows effectiveness of upsell and cross-sell strategies Churn impact: Reveals true cost of customer acquisition vs. retention Investor confidence: Key SaaS metric for valuation and growth assessmentIndustry benchmarks
- Best-in-class SaaS: 120%+ NRR
- Good SaaS companies: 110-120% NRR
- Average performance: 100-110% NRR
- Below average: < 100% NRR
Calculation methodology in Zenskar
Data sources
- Monthly recurring revenue (MRR) from active subscriptions
- Customer cohort tracking to identify existing vs. new customers
- Subscription change events (upgrades, downgrades, cancellations)
- Usage-based billing adjustments normalized to monthly values
Time period considerations
- Monthly NRR: Month-over-month retention analysis
- Annual NRR: Year-over-year retention for seasonal businesses
- Cohort-based NRR: Retention by customer acquisition period
Visualization components
NRR trend chart
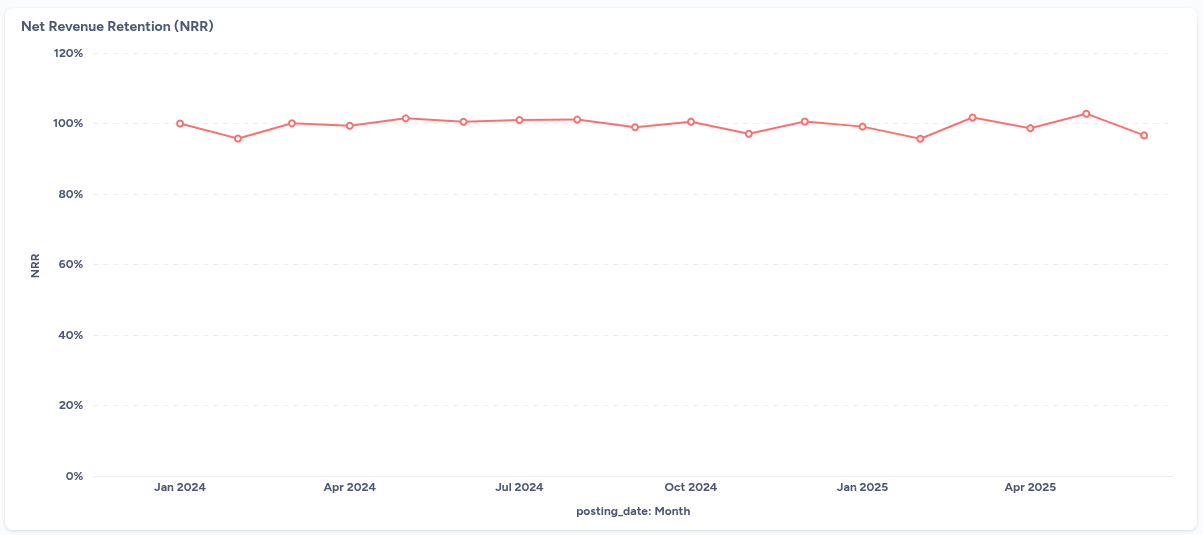 Chart type: Line chart tracking NRR percentage over time
Key visual elements:
Chart type: Line chart tracking NRR percentage over time
Key visual elements:
- X-axis: Time periods (months/quarters)
- Y-axis: NRR percentage (typically 80-120% range)
- Benchmark line: 100% NRR reference line
- Trend indicators: Color coding for performance ranges
- Upward trends: Improving expansion and retention
- Consistent >100%: Healthy existing customer growth
- Volatility: Investigate underlying expansion/churn patterns
- Declining trends: Early warning of retention issues
NRR breakdown table
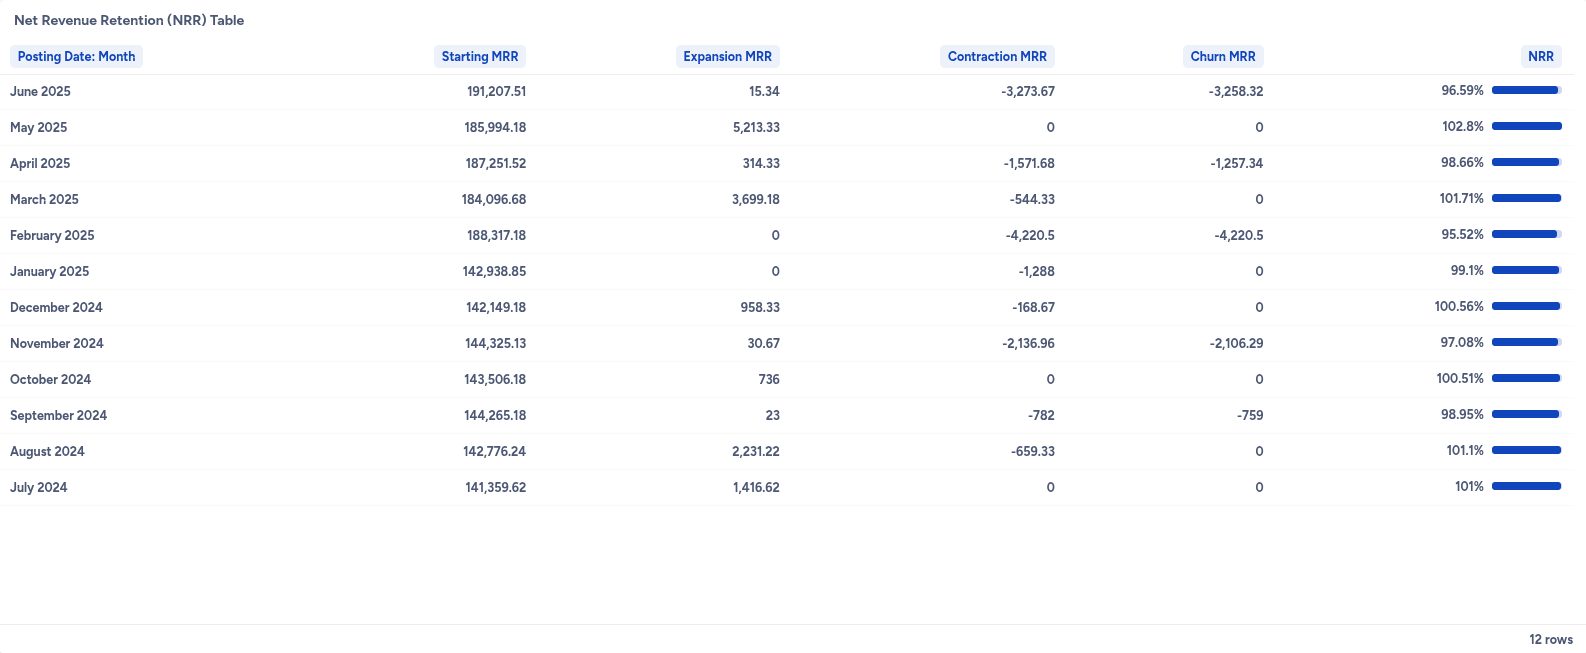
Data structure: Detailed monthly components for analysis Key columns:
- Period: Month/quarter identifier
- Starting MRR: Baseline existing customer revenue
- Expansion MRR: Upsell and expansion revenue
- Contraction MRR: Downgrade and reduction amounts
- Churn MRR: Lost revenue from cancellations
- NRR %: Calculated retention percentage
Advanced analysis techniques
Cohort-based NRR analysis
Track NRR by customer acquisition cohort:Segmented NRR analysis
- By customer size: Enterprise vs. SMB retention patterns
- By product line: Individual product retention performance
- By acquisition channel: Channel effectiveness for long-term value
- By geographic region: Regional retention variations
Leading indicators
- Expansion MRR growth: Early signal of improving NRR
- Contraction MRR increases: Warning sign of declining NRR
- Customer health scores: Predictive indicator of future NRR
- Product usage metrics: Correlation with retention performance
Relationship to other metrics
Complementary metrics
**Gross Revenue Retention (GRR) **: Pure retention excluding expansion effects- GRR focuses on baseline retention
- NRR adds expansion impact
- Together provide complete retention picture
- MRR shows total growth including new customers
- NRR isolates existing customer performance
- Combined analysis shows growth composition
- Churn rate measures customer count retention
- NRR measures revenue retention
- Revenue retention often outperforms customer retention due to expansion
Metric relationships
- High NRR + High GRR: Excellent retention with strong expansion
- High NRR + Lower GRR: Expansion masking retention issues
- Low NRR + Low GRR: Fundamental retention problems
- Stable NRR + Growing MRR: Balanced new customer acquisition and retention
Optimization strategies
Improving expansion revenue
- Usage-based pricing: Align revenue with customer value realization
- Product bundling: Encourage multi-product adoption
- Success-driven upsells: Time upgrades with usage milestones
- Account management: Dedicated resources for expansion opportunities
Reducing contraction and churn
- Customer health monitoring: Proactive intervention systems
- Onboarding optimization: Ensure strong initial product adoption
- Regular business reviews: Maintain alignment with customer goals
- Competitive analysis: Address feature gaps causing churn
Measurement best practices
- Regular monitoring: Monthly NRR tracking and analysis
- Segment analysis: Identify high-performing customer segments
- Predictive modeling: Forecast NRR trends and intervention needs
- Cross-functional alignment: Share insights across sales, CS, and product teams