> ## Documentation Index
> Fetch the complete documentation index at: https://zenskar.com/docs/llms.txt
> Use this file to discover all available pages before exploring further.
# Payments
## Overview
This document provides a comprehensive guide to the **Payments** tab within the Billings and Collections Dashboard. This tab offers crucial insights into your incoming payments, helping you monitor cash flow, track collection efficiency, and understand payment trends.
***
## Understanding the payments summary
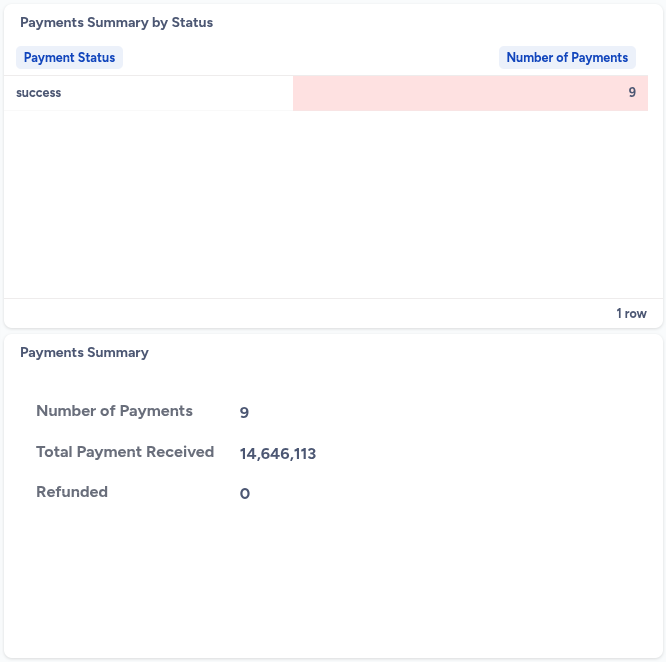
The Payments tab typically starts with a high-level overview of payment activity, providing key aggregated metrics.
* **Payments summary:** This section provides quick, aggregated numbers for overall payment performance.
* **Number of payments:** The total count of individual payments received (e.g., 9).
* **Total payment received:** The cumulative monetary value of all payments received (e.g., 14,646,113).
* **Refunded:** The total amount of money that has been refunded (e.g., 0).
***
### Payments summary by status
This report provides a quick overview of payments categorized by their processing status.
* **Understanding the payments summary by status report:** This is a simple table showing the count of payments for each status.
* **Payment status:** The current state of a payment (e.g., `success`).
* **Number of payments:** The count of payments corresponding to that status (e.g., 9 successful payments).
* **How this report aids payments analytics:**
* **Quick status check:** Instantly see the breakdown of payment statuses, identifying if there are pending, failed, or successful payments.
* **Issue identification:** A high number of non-`success` payments could indicate processing issues or customer payment problems.
***
## Payments by customers
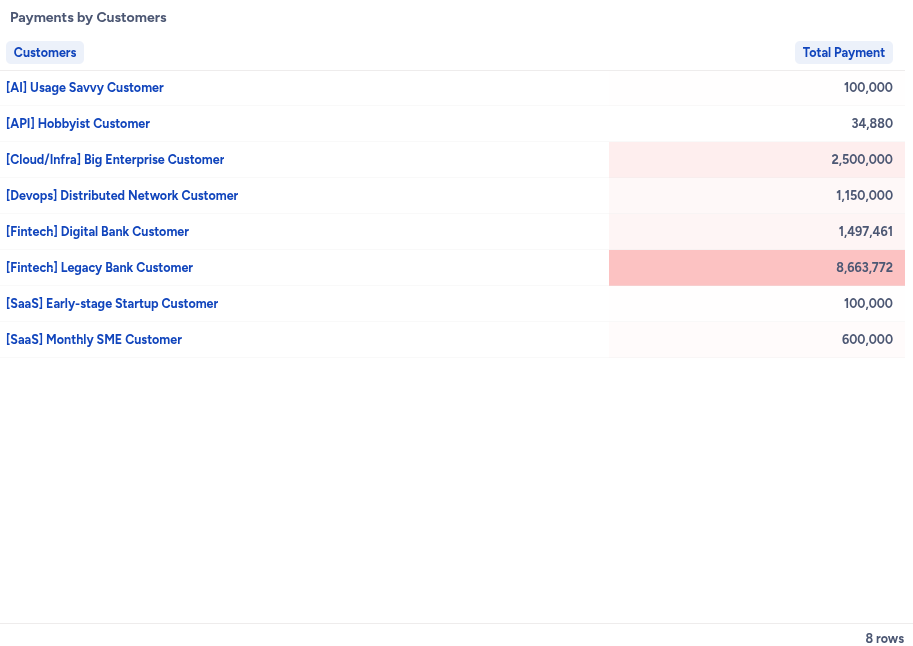
This report breaks down total payments received by individual customers or customer segments.
* **Understanding the payments by customers report:** This is a table listing customers and the total payment amounts they have made.
* **Customers:** Lists individual customer names or predefined customer segments (e.g., `[All] Usage Savvy Customer`, `[Fintech] Legacy Bank Customer`).
* **Total payment:** The cumulative amount of money received from each specific customer or segment. The red shading, as seen for `[Fintech] Legacy Bank Customer`, might indicate a significant payment or a payment that stands out for some reason (e.g., a large single payment or a recent high-value transaction).
* **How this report aids payments analytics:**
* **Top payers identification:** Easily identify which customers or segments contribute the most to your received payments.
* **Customer payment behavior:** Understand payment patterns at a granular customer level.
* **Revenue concentration:** Assess if your payment inflows are concentrated among a few customers, which can inform business risk.
***
## Payments summary (by period)
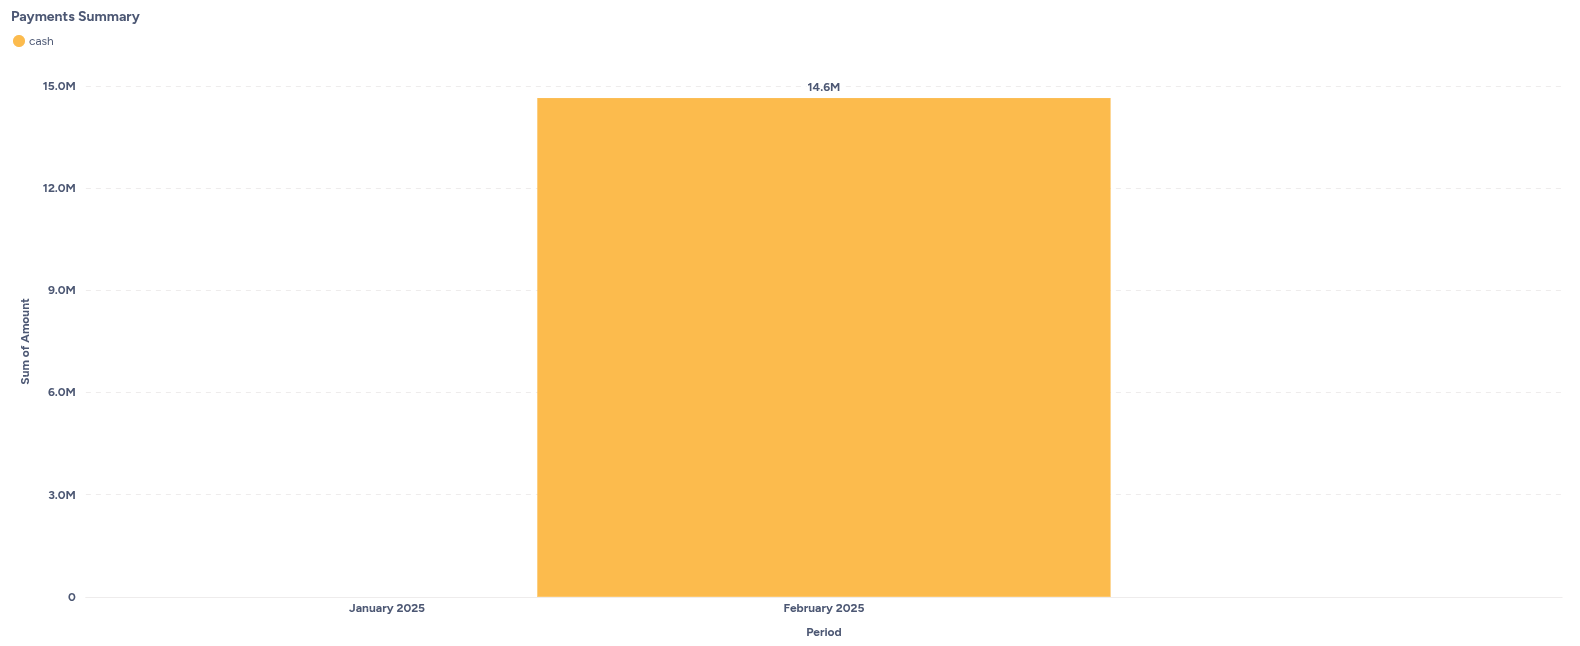
This chart visualizes the total amount of cash received over time.
* **Understanding the payments summary chart:** This is a bar chart showing the sum of cash received over different periods.
* **X-axis (Period):** Represents the timeline, typically by month (e.g., `January 2025`, `February 2025`).
* **Y-axis (Sum of Amount):** Represents the monetary value of payments received, in millions (e.g., `3.0M`, `6.0M`, up to `15.0M`).
* **Cash (Orange bars):** Each bar indicates the total sum of cash payments received during that specific period. For example, in February 2025, `14.6M` in cash payments were received.
* **How this chart aids payments analytics:**
* **Cash flow trends:** Quickly identify periods of high or low cash inflow, helping with cash flow forecasting and management.
* **Payment volume over time:** Understand the historical volume of payments received.
* **Seasonal patterns:** Detect any recurring seasonal trends in payment receipts.
***
#### Number of payments (by period)
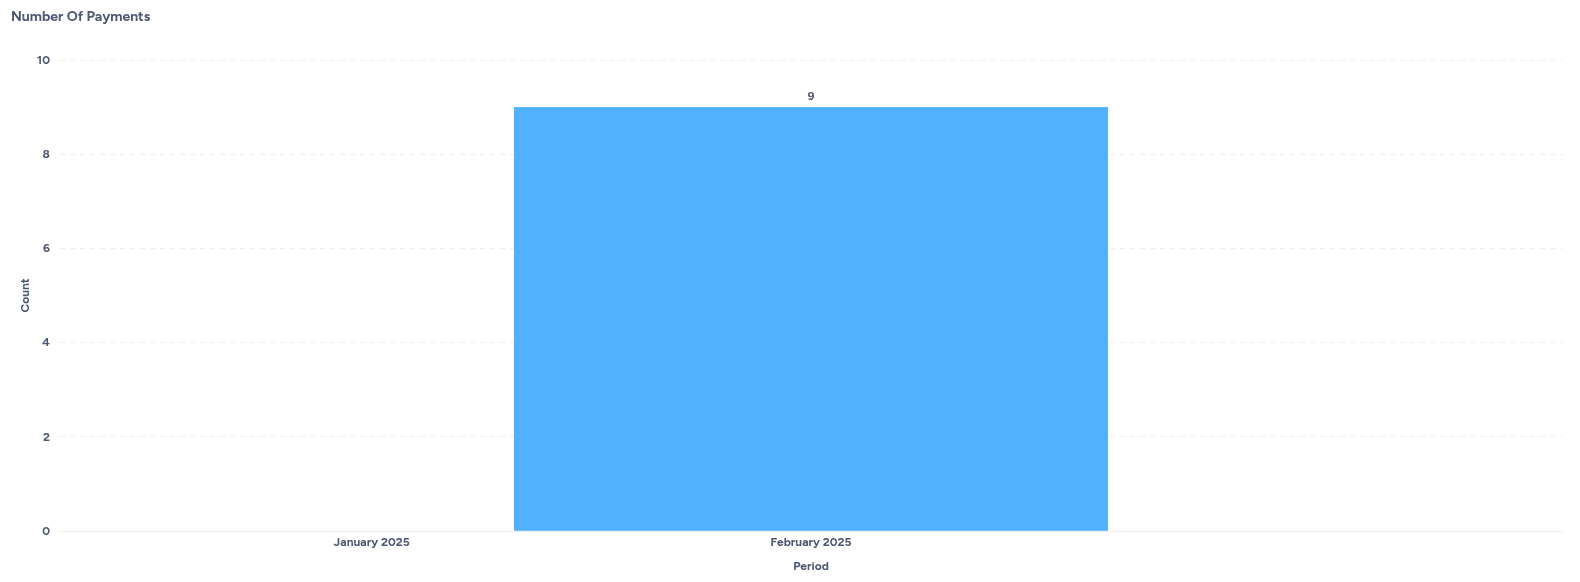
This chart visualizes the count of payments received over time.
* **Understanding the number of payments chart:** This is a bar chart showing the total number of payments received over different periods.
* **X-axis (Period):** Represents the timeline, typically by month (e.g., `January 2025`, `February 2025`).
* **Y-axis (Count):** Represents the number of payments received, ranging from 0 to 10.
* **Blue bars:** Each bar indicates the total count of payments received during that specific period. For example, in February 2025, 9 payments were received.
* **How this chart aids payments analytics:**
* **Transaction volume:** Monitor the volume of individual transactions over time, which can indicate business activity.
* **Operational efficiency:** A sudden drop or spike in the number of payments might warrant investigation into payment processing or customer behavior.
* **Reconciliation:** Helps in reconciling payment records by providing a visual count of transactions.